Not every developer works in JavaScript. A large portion of data-heavy applications are built in Python or .NET, and the charting options in those environments have historically been hit or miss. LightningChart tackles that problem head-on with dedicated libraries for both languages, and they carry the same performance-first approach as the JavaScript version. If you work in either of these environments and you regularly deal with serious data, this is genuinely worth your full attention right now.
Starting with Python, most data scientists are already comfortable with tools like Matplotlib or Plotly. LightningChart Python steps into that space with one clear advantage: raw speed. Benchmark results show it performs over 3,600 times faster than other Python charting libraries in real-time scenarios. That’s not a minor improvement. That’s a completely different league, and once you see it running with a large dataset, it’s genuinely hard to go back to slower alternatives.
The library supports over 100 chart types and works naturally with NumPy and Pandas, which means you’re not forced to change your existing workflow to accommodate it. It also runs inside Jupyter notebooks and integrates with GUI frameworks like PyQt and PySide for standalone application development. Chart options include XY charts, 3D charts, heatmaps, gauge charts, spider charts, and more all rendered with hardware acceleration for smooth, responsive visuals even with very heavy datasets.
For anyone doing financial work in Python, there’s a dedicated package called LightningChart Python Trader. It comes loaded with over 100 built-in technical indicators, drawing tools, and advanced technical analysis features built specifically for financial data visualization. It’s a serious toolkit for serious financial applications and a strong option for trading platforms.
Getting started is simple. You install it via pip, set your license key, and you’re up and running in just a few lines of code. A 7-day free trial is available for personal and data science use, with a per-seat perpetual license available for developers building commercial software.
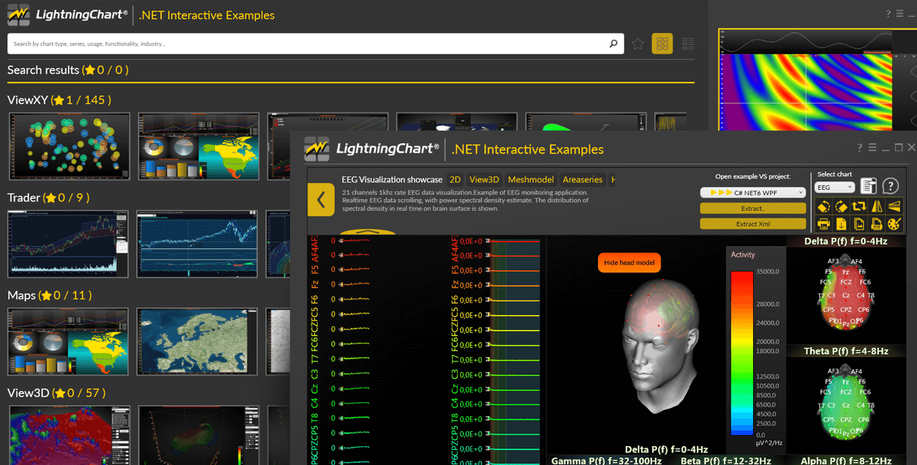
On the .NET side, LightningChart has been the benchmark for performance charting in Windows desktop applications since 2009. It supports WPF, WinForms, and UWP, and the data capacity is genuinely staggering up to 1 trillion data points visualized in real time. That’s the kind of scale that matters in medical research, engineering systems, and financial platforms where data integrity is everything and performance simply can’t be compromised.
The library includes over 170 chart types covering everything from standard 2D charts to advanced 3D surfaces, polar charts, Smith charts, geographic maps, volume rendering, and specialized ECG and EEG signal visualizations for medical and scientific use. Every element is fully customizable without any performance trade-off, and over 215 interactive examples are included to help you get moving quickly regardless of your experience level.
A free 30-day trial is available, with individual licenses offered in Bronze through Platinum tiers. Whether you’re a data scientist working in Python notebooks or a .NET desktop developer building specialized software, LightningChart gives you the tools to handle demanding data without slowing down.